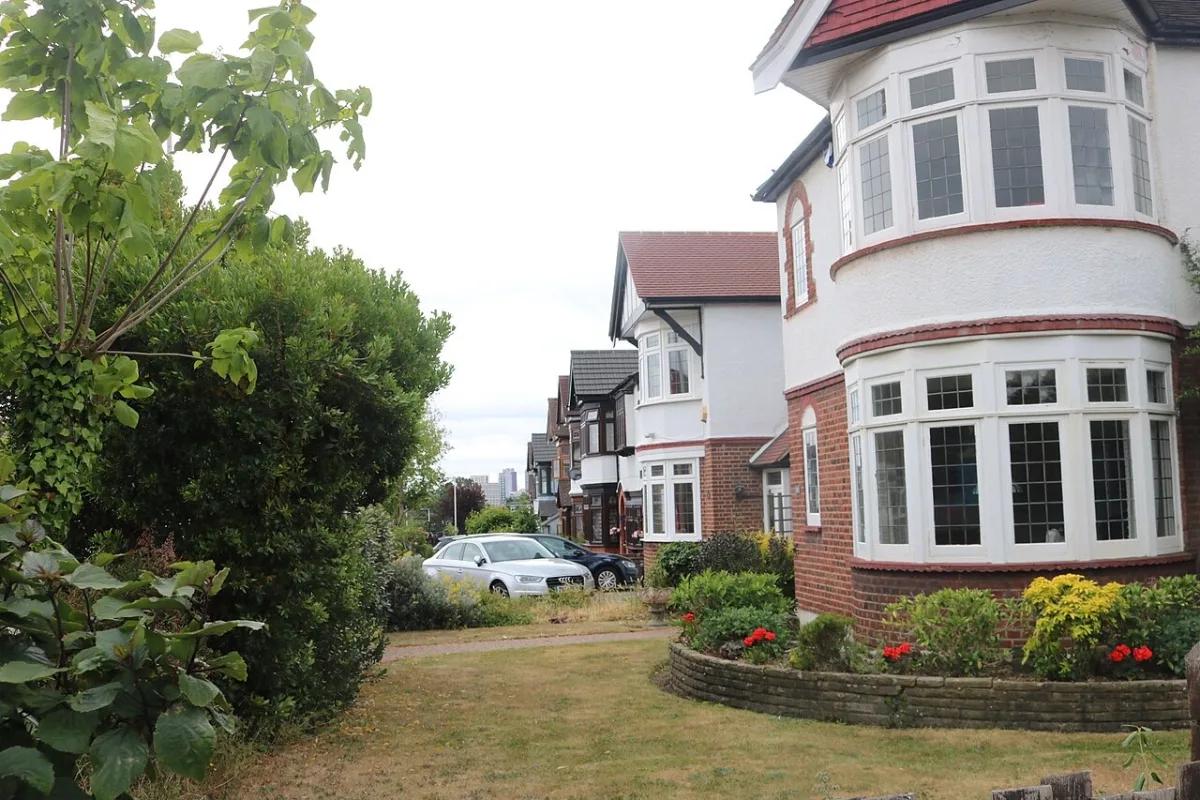

The middle IG1 sale was £435,000 and the middle Redbridge sale £500,000. Medians for Ilford, Wanstead, Woodford, Barkingside and Hainault from 2,110 sales.
Asking prices tell you what sellers hope for. What counts is what homes actually change hands for, and every completed sale in England and Wales is recorded by HM Land Registry and published. This page reads those records for Redbridge: the official borough average, the one number that makes this borough unusual right now, and what the middle home sold for in Ilford, Wanstead, Woodford Green, South Woodford, Barkingside, Seven Kings and Hainault.
Two things to fix before the numbers. First, the official index covers the whole Redbridge borough, which runs from the Barking boundary at Loxford up to the edge of Epping Forest and contains both £1.6 million detached houses in Wanstead and £225,000 flats in central Ilford. The borough average describes neither. Second, Redbridge is a house market, not a flat market: houses were 71% of everything sold here in the last year, the reverse of inner London.
The headline figure, and why it is unusual
The average home in Redbridge sold for £495,977 in June 2026, the most recent month published in the UK House Price Index. That is up 3.6% over the year.
That single sign is the story. Over the same twelve months London fell 2.5% to £553,870 while England rose 1.8% to £293,262. Redbridge is one of the boroughs going the other way from the capital it sits in, and only Barking and Dagenham and Havering rose faster of all 33. A year ago the gap between the Redbridge average and the London average was £89,149. In June 2026 it was £57,893, because Redbridge climbed while London slid.
There is no mystery about why. Redbridge is a zone 4 borough where a house is still the normal thing to buy, and it gained a fast railway in 2022. The Elizabeth line put Ilford 18 minutes from Liverpool Street with 12 trains an hour at peak, and the buyers priced out of Stratford and Leytonstone moved along the line. Meanwhile the borough is building almost nothing: 337 homes were completed in 2023/24 against a target of 1,409. Demand that rises against supply that does not is the whole of it.
What it means for you
If you are buying, this is not a soft market and waiting has not been paying. The borough average is within £9,000 of its highest point in the last five years, which was £504,662 in September 2025. The decision that matters more than timing is the flat-or-house one: the median flat in the borough sold for £295,000 over the last year and the median terrace for £530,500, so the step up is about £235,000 and it is the largest single choice on this page.
If you are selling, you are in a rarer position than most London sellers this year, but the borough average hides how uneven it is. IG1 and IG7 sit around £410,000 to £435,000; IG8 and E18 sit at £578,500 and above. Price against your postcode sector, not against the borough.
If you are staying put, your home is worth roughly 3.6% more than it was a year ago in cash terms.
Prices by property type
Borough averages for June 2026 from the UK House Price Index:
- Detached houses: £1,123,235. Wanstead, Woodford Green and the Clayhall fringe, and a small share of sales.
- Semi-detached houses: £700,446. The classic interwar Redbridge house, and the borough’s defining stock.
- Terraced houses: £549,176. The most common thing sold here by a distance.
- Flats and maisonettes: £312,545. Cheaper than the London flat average by £118,491.
The same data splits buyers rather than buildings. A first-time buyer in the borough paid an average of £427,538 in June 2026, which is £44,091 below the London first-time-buyer average of £471,629. A home mover paid £594,891.
What each part of the borough actually sells for
This is where the borough average stops being useful.
The table below is our own analysis of 2,110 residential sales recorded in the Redbridge district that completed between 1 July 2025 and 30 June 2026, taken from HM Land Registry Price Paid data. It shows the median, the middle sale, which one enormous transaction cannot distort. The borough median over that period was £500,000; the mean over the same sales was £539,081.
A note on the postcodes, because Redbridge is cleaner than most London boroughs here. IG1, IG2, IG3, IG4, IG5, IG6 and E18 sit wholly or almost wholly inside the borough. Only three rows are slivers: IG7 is the Redbridge end of Hainault (most of IG7 is Chigwell, in Essex), RM6 is the Redbridge side of Chadwell Heath, and E12 is Aldersbrook, the small and expensive Redbridge corner of a postcode that is otherwise Manor Park in Newham. Only sales the Land Registry records in the Redbridge district are counted below.
| Outcode | Mainly | Median | Sales |
|---|---|---|---|
| E12 | Aldersbrook, the Redbridge sliver only | £920,000 | 27 |
| IG8 | Woodford Green and Monkhams | £625,251 | 294 |
| E18 | South Woodford and Churchfields | £578,500 | 226 |
| IG5 | Clayhall and Fullwell Cross | £573,000 | 111 |
| E11 | Wanstead Village and Wanstead Park | £560,000 | 185 |
| IG4 | Redbridge and the Clayhall edge | £545,000 | 60 |
| IG3 | Seven Kings, Goodmayes and Mayfield | £500,000 | 194 |
| IG6 | Barkingside, Fairlop and Hainault | £490,000 | 273 |
| IG2 | Gants Hill, Aldborough and Newbury | £477,500 | 164 |
| RM6 | Chadwell Heath, the Redbridge side only | £470,000 | 140 |
| IG1 | Ilford town, Cranbrook, Valentines and Loxford | £435,000 | 315 |
| IG7 | Hainault, the Redbridge side only | £410,000 | 82 |
E12 sits at the top on only 27 sales, so treat it as a small sample rather than a league position. Aldersbrook is a single Edwardian estate wedged between Wanstead Flats and the City of London Cemetery, and almost everything sold there is a house.
Ilford on its own
IG1 is the busiest market in the borough and the cheapest of the large ones. Its 315 sales carried a median of £435,000, £65,000 below the borough median. Inside it the spread is wide, and it runs on a clear north to south line:
| Sector | Roughly | Median | Sales |
|---|---|---|---|
| IG1 3 | Cranbrook and Valentines, north of the High Road | £565,000 | 89 |
| IG1 2 | Loxford and the Clementswood edge, south of the station | £428,000 | 95 |
| IG1 1 | Ilford Town and Clementswood, around the town centre | £399,000 | 71 |
| IG1 4 | Valentines and the Ilford Town fringe towards Ley Street | £377,500 | 60 |
There is £187,500 between the top and bottom Ilford sectors, and they are a twenty-minute walk apart. Cranbrook, the streets running north from the High Road towards Valentines Park, is a different market from Loxford and the town centre, where most of what sells is a flat.
That gap is mostly what is being sold rather than what a given home costs. Across IG1, 95 of the 315 sales were flats at a median of £225,000, against 189 terraced houses at £475,000 and 28 semi-detached at £715,000. A flat in Ilford is the cheapest way into the borough by a long way.
Wanstead, Woodford and the north of the borough
| Sector | Roughly | Median | Sales |
|---|---|---|---|
| E12 5 | Aldersbrook, beside Wanstead Flats | £920,000 | 27 |
| IG8 0 | Monkhams, the western side of Woodford Green | £790,000 | 83 |
| IG8 9 | Churchfields and the Woodford Green fringe | £765,000 | 49 |
| E18 1 | South Woodford, north of the station | £650,000 | 79 |
| E11 2 | Wanstead Village and the High Street | £628,500 | 136 |
| IG8 7 | Woodford Bridge and the Broadmead Road area | £625,000 | 87 |
| IG5 0 | Clayhall and Fullwell Cross | £573,000 | 111 |
| IG6 1 | Barkingside village and the Aldborough edge | £565,000 | 73 |
| E18 2 | South Woodford and Churchfields, south of the station | £550,000 | 147 |
| IG4 5 | Redbridge and Clayhall | £545,000 | 60 |
| IG8 8 | Woodford Bridge, towards the Roding | £537,500 | 75 |
| IG2 6 | Gants Hill and the Barkingside fringe | £512,000 | 84 |
| IG3 9 | Goodmayes and Mayfield | £505,000 | 114 |
| IG3 8 | Seven Kings and the Newbury edge | £490,000 | 80 |
| IG6 2 | Fairlop and Fullwell | £480,000 | 127 |
| IG6 3 | Hainault, the Redbridge side | £450,000 | 73 |
| IG2 7 | Aldborough Hatch and Newbury Park | £443,000 | 80 |
| RM6 4 | Chadwell Heath, the Redbridge side | £430,000 | 107 |
Two patterns run through that table. The first is Epping Forest: prices rise as you move north west towards the forest edge, and the four most expensive sectors in the borough all sit against green land, whether that is Wanstead Flats, Highams Park or Monkhams. The second is the Central line’s own geography. Wanstead and South Woodford, on the main branch, sit £100,000 to £150,000 above Barkingside, Fairlop and Hainault, which are on the Hainault loop and take considerably longer to reach the City.
Wanstead is also where the borough’s most expensive houses are. Across E11, the eight detached houses that sold carried a median of £1,650,000 and the 31 semi-detached a median of £1,015,000, both figures well clear of anything else in Redbridge.
One number worth watching: new build
Of the 2,110 residential sales in the year to June 2026, just five were flagged as new build. That is 0.2%. Part of that is a known lag, because new-build sales tend to register late and affordable and social homes never appear in the sold-price record at all. But it lines up with what the council’s own monitoring shows, which is a borough that has not hit an annual housing target since 2006/07. If you want a new-build home in Redbridge, the sold-price record says there is very little of it changing hands.
Frequently asked questions
What is the average house price in Ilford?
The middle home in the IG1 postcode sold for £435,000 over the year to June 2026, across 315 recorded sales. The Redbridge borough average published by the UK House Price Index was £495,977 in June 2026. The two numbers measure different things: IG1 is Ilford, and the borough figure includes Wanstead and Woodford Green, which are considerably more expensive.
Are Redbridge house prices going up or down in 2026?
Up. Redbridge rose 3.6% in the year to June 2026 while London as a whole fell 2.5%. That was the third-biggest annual rise of the 33 London boroughs. The borough average of £495,977 is within about £9,000 of its highest point in the last five years.
Which is the cheapest part of Redbridge to buy in?
On postcode sectors with at least 50 recorded sales, IG1 4, the Valentines and Ley Street side of Ilford, was the cheapest at a median of £377,500, followed by IG1 1 around the town centre at £399,000 and RM6 4 in Chadwell Heath at £430,000.
Which is the most expensive part of Redbridge?
Aldersbrook (E12 5) at a median of £920,000, though on only 27 sales. Of the larger markets, Monkhams in Woodford Green (IG8 0) was highest at £790,000 across 83 sales.
How much is a flat in Ilford?
The median flat or maisonette sold in IG1 went for £225,000 over the year to June 2026. Across the whole borough the median flat was £295,000, and the UK House Price Index put the Redbridge average flat at £312,545 in June 2026.
Where can I check what a specific house sold for?
Every completed sale in England and Wales is public. Look up a street or a single address for free on the HM Land Registry Price Paid service.
Sources
- UK House Price Index, Redbridge (ONS and HM Land Registry) for the borough average, annual change, property-type and buyer-type figures.
- HM Land Registry Price Paid data for the 2,110 Redbridge-district residential sales completed between 1 July 2025 and 30 June 2026 that the medians on this page are calculated from.
- Redbridge Local Plan Authority Monitoring Report 2023-24 for housing completions against target.
- HM Land Registry Price Paid search to check any individual address.
Land Registry figures are provisional and revised as more sales complete, and the last two months of any window are under-counted because of registration lag. Always confirm the latest numbers against the linked sources before making a decision.
Have your say